I was tech lead of the Data Platform SRE team at Twitter through 2022 and on the reactive side of my role, I spent most of my time on fleet health operations which we called "breakfix". Tens of thousands of data nodes and 100+ head nodes, across a handful of datacenters, with no single system that could tell you the truth about any of them.
Four years later, I've been going back through the architecture and trying to work out what actually made it work. Not which tools we used — most of those names won't mean anything outside Twitter, and the equivalents exist everywhere — but what the shape of the system was, and why that shape was the right one for the problem.
This is the "why it worked" post. There's a companion post Text Files as Tables about the sorted-file query engine hiding inside it; this one is about the Twitter implementation specifically.
Three sources of truth, and none of them winning
The first thing that mattered was recognising that no single system was authoritative. We had three:
-
Audubon, the machine database of record: host inventory, role membership via Colony, lifecycle state in Wilson (allocated, managed, repair, decommissioned), per-host attributes like the current breakfix ticket or the
hadoop_excludeflag. That flag was more than a marker: setting it in Audubon was the intent, and a downstream path (Puppet-driven export, config sync) then regenerated the HDFS exclude file (/etc/...) that HDFS already knew how to read. Within a refresh cycle HDFS and YARN would start draining the node from service. The point is that Audubon wasn't just a passive record; a single attribute change was the wire into the cluster control plane, even if the wire had a couple of hops in it. -
Metrics and Healthchecks : per-node telemetry on Hadoop was collected by an on-node daemon called
vexdpolling every minute (or slower) and listening on local HTTP for cheap local access to those metrics. These metrics were then pushed minutely into Cuckoo, the central time-series database. Operators queried Cuckoo via CQL — its own query language, unrelated to Cassandra's CQL — for fleet-wide or per-node questions. -
The Hadoop cluster control plane : HDFS and YARN themselves, which had their own opinions about whether a node was in service, draining, dead, or in some mixed state that none of the other two sources could see.
None of the three was authoritative on its own. Each system was correct in isolation and wrong in practice. Audubon lagged reality because humans and slow workflows updated it. The metrics pipeline was timely but didn't know about lifecycle or tickets. The cluster control plane knew about service state but not about whether a host was ticketed for hardware repair or flagged for a firmware update. Any decision worth automating needed information from all three.
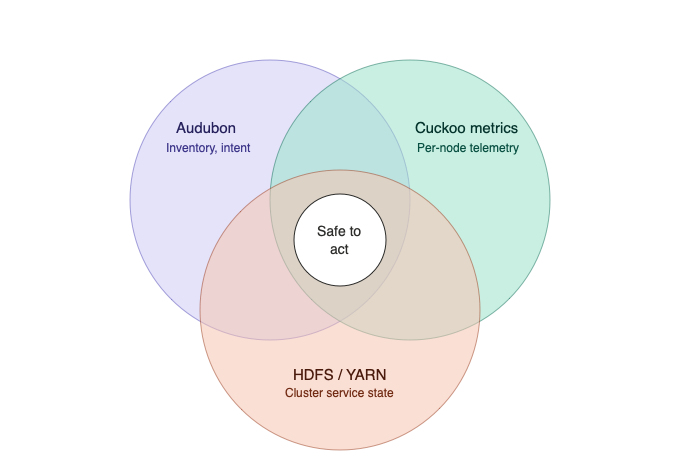
What worked was treating them as independent observers and reconciling them with
set algebra. Not "which one is right?" but "which hosts appear in all three in a
way that makes action safe?" The implementation was sorted text files and
comm, join, awk, grep with Audubon queried through a CLI called loony
and fleet-wide remote execution done through a service called Fleetexec.
Sorted files as the data plane
The dominant idea in the shell layer was: one host per line, sorted, on disk.
Named sets — hadoop-workers, all, managed-puppet-failing, dead-reboot,
watch-plans, dozens of others — were files in a working directory. Set
difference was comm -23 a b. Set intersection was comm -12 a b. Joining
inventory attributes to a group was join against a wide-format dump of the
machine database, like a SQL join but using text columns instead of table
columns.
A typical rekick candidate set, informally:
all
  - hadoop_exclude
  ∩ responsive
  ∩ puppet_ok
  → candidate-rekick
Three lines of pipeline, four files on disk, one decision. Every intermediate set was inspectable after the fact.
The reasons this held up:
-
Partial failure was free. If a run died halfway, the files on disk were still valid as inputs to the next run. The next invocation could skip expensive discovery steps whose outputs already existed.
-
Incident review was just
lsandgrep. When someone asked "why did we drain these ten hosts?", the answer was in the working directory. Not in a log you had to reconstruct — in the actual group files the decision was made from. -
Diffing two runs showed drift directly.
diff yesterday/dead-rekick
  today/dead-rekick
was often the fastest way to understand what had changed in the fleet overnight. -
The working directory was logged. Each pass of the outer loop
teed its transcript to a file in the day's breakfix directory, so the full sequence of decisions — group sizes,hadoop-admincalls, Fleetexec fan-outs, warnings — was recoverable after the fact. The transcript plus the group files was enough to reconstruct what happened in a pass without having to re-run it.
APIs alone would have failed all of these. The file-backed approach wasn't primitive — it was load-bearing.
The Python / shell split
The automation ran in two languages and the boundary between them was deliberate. Shell did the high-volume set crunching with one large driver plus a pile of helpers. Python did anything where getting the semantics wrong would cause immediate operational harm, and was a layer wrapping the Hadoop HDFS and YARN CLIs and the fleetexec CLI.
The rule I ended up using to decide where a new piece of logic went: if violating it could corrupt data or take a cluster down, it belongs in Python and wants tests.
| Python | Shell | |
|---|---|---|
| Test | Could it corrupt data or take a cluster down? | Would the next stage catch a bad output? |
| Kind of rule | Correctness invariants | Policy budgets, set algebra |
| Lives with | Tests, type checking, semantic workflows | Sorted files, comm/join/awk pipelines |
| Example | "Don't rekick a worker still in HDFS service" | "This cluster tolerates 6% of workers offline" |
| Example | "Drain a host, wait for decommission, verify replication, release the ticket" | "Set of failing-puppet ∩ responsive ∩ not-already-ticketed" |
Conflating those two kinds of rule in treating policy caps as if they were safety invariants, or pushing safety checks down into shell glue, was one of the most consistent anti-patterns I saw. Keeping them in different files and different languages made the split visible.
Caps, floors, ceilings, and shuffling
The driver had per-cluster policy caps on every destructive operation: rekicks, burnins, firmware updates, reboots, drains. Percentages scaled to cluster size, with a floor of 1 and a ceiling of hundreds.
The floor and the ceiling did different jobs, which took me longer than I want to admit to articulate.
The floor existed because percentage calculations on a small cluster rounds to zero, and a cluster that never gets routine maintenance accumulates debt that eventually forces an emergency intervention — which then takes out a much larger fraction than the routine work ever would. Always allowing one node inverts that failure mode: small clusters take proportionally more disruption per pass but stay current. They were also mostly dev clusters so the alerting was tuned to be coarser for these.
The ceiling existed because the largest clusters could have their 6% budget work out to hundreds of hosts, and the coordination and observation cost of that many simultaneous drains exceeded what the automation and the human supervising it could usefully handle. The ceiling protected the operator, not the cluster. It was also a safety valve.
The caps answered "how many." They did not answer "which ones," and that
distinction caused issues before it was fully realised. Sorted host lists
correlate with physical topology; adjacent names tend to mean adjacent racks,
same top-of-rack switch, same power distribution. head -n 5 on a sorted
candidate pool reliably gave you five hosts in the same rack. The count cap was
honoured; the blast radius was not.
The fix was simple: shuf -n instead of head -n, applied uniformly across
every size-capped operation in the driver. Five hosts sampled from anywhere in
the pool, not five adjacent ones. The cap bounded count; shuf bounded
concentration. Either alone was insufficient.
The composition with idempotent refresh was a bonus. Over a handful of loop
iterations, shuf spread the work across the candidate pool without any
stateful round-robin — no cursor, no "last host picked" tracking, nothing for
the volatile-file-refresh model to fight with. Randomness did for free what
state would have made brittle.
On particular issues related to draining and dataloss, because of HDFS layout, we had to guarantee that maintenance was spread across semantic data groups such that not all three replica copies of a block were taken down at once; this was ensured by tracking drains against an Audubon attribute that recorded these groups. Given our placement constraints, taking all of a single group out at once was data-safe by HDFS data placement policy.
Policy as a classifier
The per-cluster policy wasn't a table in a configuration file. It was actually a small classifier in the driver: several percentage archetypes such as default, dense, small with some exceptions for clusters that didn't fit any archetype.
The archetype names encoded the reason, not just the number. "Dense" meant
storage-heavy clusters where nodes were fat and jobs were rare, so a slightly
higher tolerance was safe. "Small" meant experimental clusters where we wanted
to signal conservatism even when the maths would have allowed more. One
genuinely pathological cluster was hardcoded to max=1 because no archetype's
percentage produced the answer we wanted for a cluster of that size; it was
small but it was production critical.
The honest name for this pattern is reviewed-policy-in-code. The numbers were
tuned from operating experience, checked into a shell script,
version-controlled, change-reviewed like any other code, and blame-able down to
the incident that motivated each adjustment. git log -p answered "when did the
HBase drain cap change and why?"
The approach gave up three things: runtime adjustability without a deploy, self-service for cluster owners, and machine-readable policy introspection. For a tool operated by the same small group of SREs who maintained the script, those tradeoffs were fine. The co-location of policy and enforcement — the number was in the same file as the code that consumed it — was worth more than any of what we gave up.
"Do nothing" as a first-class outcome
In retrospect, the design choice that mattered most was that the automation was allowed to do nothing.
When the per-cluster drain budget was already consumed by existing breakfix work (dead hosts, failed disks, hosts mid-repair, plans in progress in Wilson) the driver computed zero remaining headroom and proposed zero new drains. When the hosts "ready to come back" group was empty, the outer loop exited its happy path instead of forcing a round of remediation.
This was not a special case. It was the pervasive design.
The scripts computed what was safe, acted within it, and if the safe set was empty, acted on the empty set. Recognising "I can't usefully do anything right now" and stopping turned out to be a stronger guarantee than "always make progress," and it was the property that made the whole system trustable enough to run in a loop between operator check-ins.
The per-pass summary counts were things an operator could scan in ten seconds to decide whether to keep the loop running, kill it, or page someone. A zero drain count on a pass meant the loop had looked at the state and concluded there was nothing safe to add — useful information, not a failure mode.
The human loop
All of the above ran inside a long-running outer loop, typically in a detached
tmux session pinned to a particular datacenter. Each iteration invalidated
volatile classification files, reran the scanner, fanned out on-node
healthchecks over Fleetexec, printed summary counts, optionally submitted a new
batch of drain work, then slept and repeated.
The per-datacenter framing mattered. Blast radius stayed geographic — a bad change to the driver running in one datacenter wouldn't simultaneously affect others. Detaching the session meant an operator losing a VPN connection didn't kill a half-completed pass. Keeping the transcript on disk meant the run could be inspected after the fact without having to recreate the state.
The human loop was: start the driver, let it run, read the summary counts once
an hour or so, intervene when something looked wrong. "Wrong" was usually a
count that was drifting in the unexpected direction — the dead-rekick group
growing instead of shrinking, or draining stuck at the same number across
three passes. The scripts produced enough signal for a human to notice the
patterns that the scripts themselves weren't competent to diagnose.
What I'd do differently
A few things, with four years of distance.
The one large shell driver scanner was hundreds of lines too long by the end. Not because shell was the wrong language for set-algebra-over-files, but because once something is big enough that you can't hold it in your head, moving pieces of it into helpers with clear contracts buys more than the cost of the extra files. We did some of that extraction but not enough.
Commit messages on the policy constants were inconsistent. When the numbers were good, we knew why; when the numbers were old, we had to do archaeology. A one-line convention like "raise HBase drain cap from 3% to 5% — INCIDENT-XXXX showed recovery was bandwidth-bound" would have preserved the institutional memory that otherwise evaporated with the people who tuned the numbers.
The shuf pattern should have been documented as an explicit principle earlier.
I arrived at it incrementally, probably after an head-style truncation kept
hitting the same nodes. Stating "sort for set operations, shuffle before acting"
as a rule up front would have saved us working it out the hard way.
The Python / shell boundary was mostly right but occasionally drifted. A few pieces of semantically-rich logic ended up in shell because that was where the surrounding code was, and a few pieces of set-crunching ended up in Python because that was where the surrounding code was, but that's ok. I don't recall either direction causing an incident, but both directions made the code harder to reason about at the boundary.
I would have likely leaned harder on the per-pass transcripts as teaching material. The logs were there, the group files were there, but walking a new SRE through a real captured run — "here's what the driver decided on this pass, here's why, here's what the counts looked like by the end" — was something we did ad hoc rather than systematically. The documentation was the code, for better or worse.
Thoughts
The patterns that carried the most weight - reconciliation as intersection,
sorted files on disk, the safety / policy split, the floor / ceiling asymmetry,
shuf before acting, "do nothing" as a legal output — are not specific to
Hadoop, or to Twitter, or to the tooling generation the code was written in.
They're what fleet reliability looks like when the automation itself becomes
part of the system you have to keep reliable.
The broader version of those lessons is probably another post. This one was about what actually happened, in a specific place, at a specific time, with a specific set of constraints. The tools may be gone; the patterns transfer.
Update 2026-05-01: The companion post is published Text Files as Tables